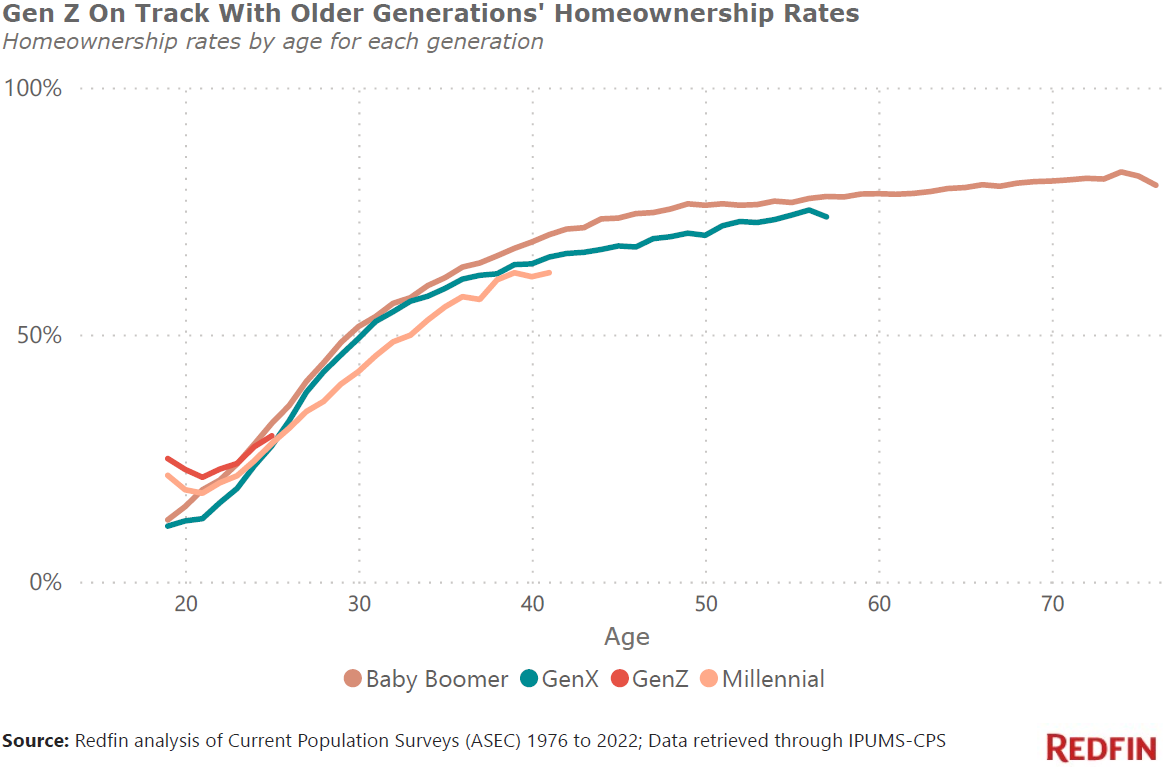
- Gen Zers are tracking ahead of their parents’ homeownership rate: 30% of 25-year olds owned their home in 2022, higher than the 27% rate for Gen Xers when they were the same age. But the Gen Zers who didn’t take advantage of the pandemic-era’s low mortgage rates could be left behind.
- Millennials are tracking behind their parents: 62% of 40-year-olds owned their home in 2022, lower than the 69% rate for baby boomers at the same age.
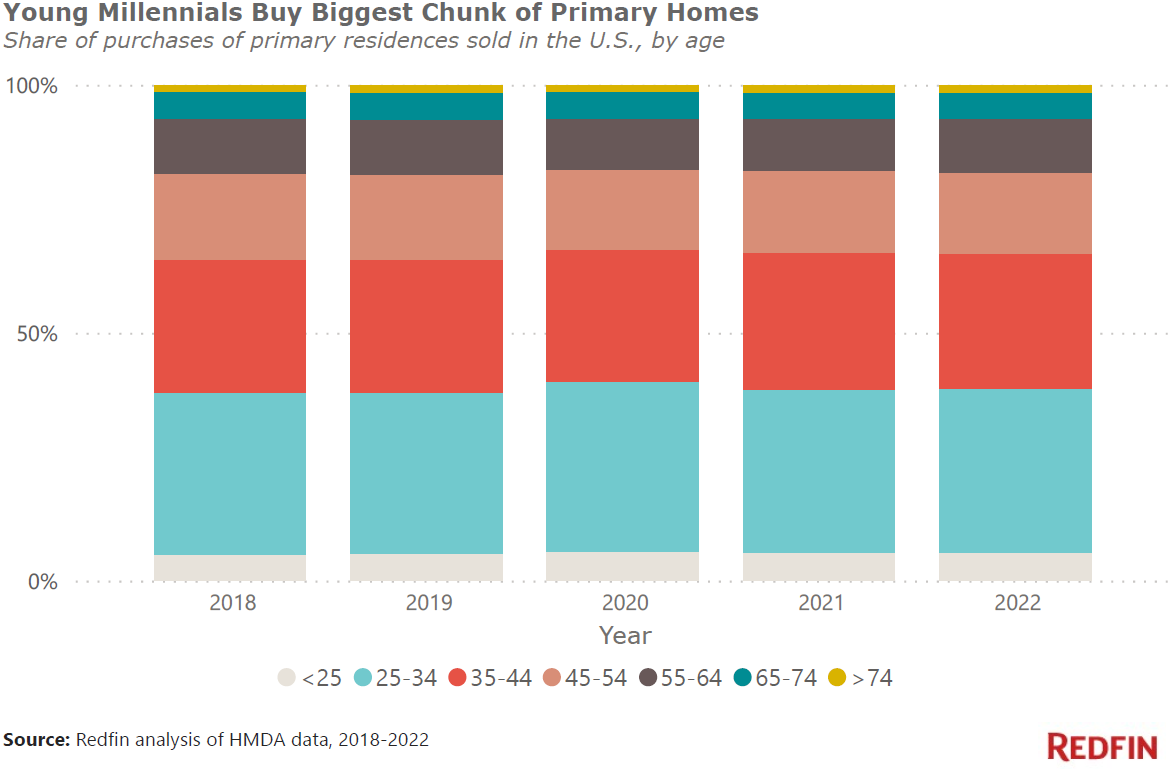
- Millennials buy more homes than other generations, with 25-44 year olds buying roughly 60% of homes that sold over the last several years. Those “mortgage millennials” have an edge over millennials who missed out on buying before rates shot up.
- Gen Z homebuyers are most common in affordable parts of the country like Virginia Beach, where they bought 9% of homes sold in 2022. Millennial buyers are most prevalent in job centers like Seattle, where they bought more than 40% of homes sold.
Some Gen Zers were able to take advantage of record-low mortgage rates in 2020 and 2021 to buy homes, putting the generation on a slightly better homeownership trajectory than their parents. But those who didn’t buy homes during that period may struggle to break into the market now that housing costs have shot up and the economy is showing signs of slowing. Nearly one-third (30%) of 25-year-olds owned their home in 2022. That’s slightly higher than homeownership rates for millennials (28%) and Gen Xers (27%) when they were 25, and slightly lower than the rate for baby boomers (32%) when they were 25.

Gen Zers were 10-25 years old in 2022 (born 1997-2012); only adult Gen Zers (19-25 years old) were included in this analysis. Millennials were 26-41 (born 1981-1996) in 2022, Gen Xers were 42-57 and baby boomers were 58-76. Scroll to the bottom of this report for more methodology information.
Gen Zers tracking along with their parents’ homeownership rate is counter to the common narrative that it’s more difficult for today’s 20-somethings to buy homes than in generations past. In fact, Gen Z homeowners spent the same portion of their income on housing in 2021 (the most recent year for which income data is available) as they did three decades earlier. A 25-year-old’s median monthly mortgage payment was $1,013 in 2021, 16% of their $74,900 median income. That’s compared with a median $904 monthly payment for a 25-year-old in 1990, 16% of their $69,419 median income (adjusted for inflation). It’s worth noting that 25-year-olds buying a home now likely spend a higher portion of their income on monthly payments than those who bought in 2021, as mortgage rates have increased.
Young adults rode the rising tide of low mortgage rates and a strong job market to buy homes during the pandemic
Many Gen Zers took advantage of 3% mortgage rates to become homeowners in 2020 and 2021. The typical mortgage rate for homebuyers under 25 using a conventional loan was 3.3% in 2020 and 3.1% in 2021. They have also benefited from a strong job market and double-digit wage growth. For 16-24 year olds, wages rose 12% from a year earlier in January, roughly double the increase for the overall population. Young adults’ incomes have risen quickly largely thanks to the tight pandemic-era labor market.
“The rising tide lifted Gen Z homebuyers in 2020 and 2021; they were part of the pandemic-driven homebuying frenzy,” said Redfin Chief Economist Daryl Fairweather. “Record-low mortgage rates, remote work providing freedom to move somewhere more affordable and skyrocketing rental costs motivated some Gen Zers to break into the housing market. While the oldest of their generation had just graduated college when the pandemic started and hadn’t started building up their bank accounts, they had some financial advantages. The unemployment rate was near record lows in late 2021 and 2022, with pandemic-related labor shortages in industries that attract young workers like hospitality and retail prompting those employers to boost pay. Government stimulus payments, the pause on student loan repayments and the fact that many young adults lived with family during the lockdowns also helped Gen Zers save money.”
Younger homebuyers need less money than their older counterparts because they tend to buy cheaper homes with smaller down payments. That’s partly because people under 25 may be more flexible about home size and location than an older person who’s more likely to have children and places more value on proximity to certain schools and their office.
In 2022, the typical primary residence purchased by someone under 25 cost $235,000 and came with a $10,000 down payment (assuming a conventional loan). That’s compared to $355,000 ($30,000 down payment) for 25-34 year olds, and $405,000 ($50,000 down payment) for 45-54 year olds.
Gen Zers who don’t yet own homes face several obstacles and may fall behind. Low mortgage rates helped some Gen Zers buy homes with relatively low incomes over the last few years, but many are priced out now that rates are above 6% and home prices remain well above pre-pandemic levels.
Additionally, the Fed’s interest-rate hikes may cause a recession, which could set the generation back financially, and the average Gen Zer has even more student debt than millennials (although higher education may lead to higher-paying jobs). And the Gen Zers who can afford a home may not find one, with a limited supply of homes for sale.
Millennials, unlike Gen Zers, are tracking behind older generations’ homeownership rates
Sixty-two percent of 40-year-olds–some of the oldest millennials–owned their home in 2022. That’s compared with 69% of baby boomers when they were 40 and 64% of Gen Xers when they were 40.
Younger millennials are also behind. Just over two in five (43%) 30-year-olds owned their home in 2022, compared with roughly half of baby boomers (52%) and Gen Xers (49%) when they were 30.
“Millennials have been financially unlucky. Their parents had a more straightforward financial journey,” said Redfin Chief Economist Daryl Fairweather. “The oldest millennials entered the workforce during the 2001 recession. Then came the 2008 financial crisis, with many millennials in their first post-college job. It limited their earnings, overall wealth and ability to buy a home for many years afterward. Millennials started to gain homebuying momentum just before the pandemic, but they were once again dealt a bad hand with pandemic-related job losses in April 2020.”
“But the 2020 downturn was brief, followed by a strong recovery. Like some Gen Zers, a portion of millennials took advantage of rising incomes and record-low mortgage rates to buy a home,” Fairweather continued. “The pandemic homebuying boom is likely to lead to further inequality within the millennial generation: There are the ‘mortgage millennials’ who bought before home prices shot up more than 30% during the pandemic, or when mortgage rates were under 3%. Then there are the millennials who missed out. They’re the ones who don’t own homes and now face an uphill battle, with elevated home prices, monthly mortgage payments at a record high, and no home equity. Gen Zers are in a similar ‘haves versus have-nots’ situation.”
Older Americans most likely to own their homes; young Americans least likely
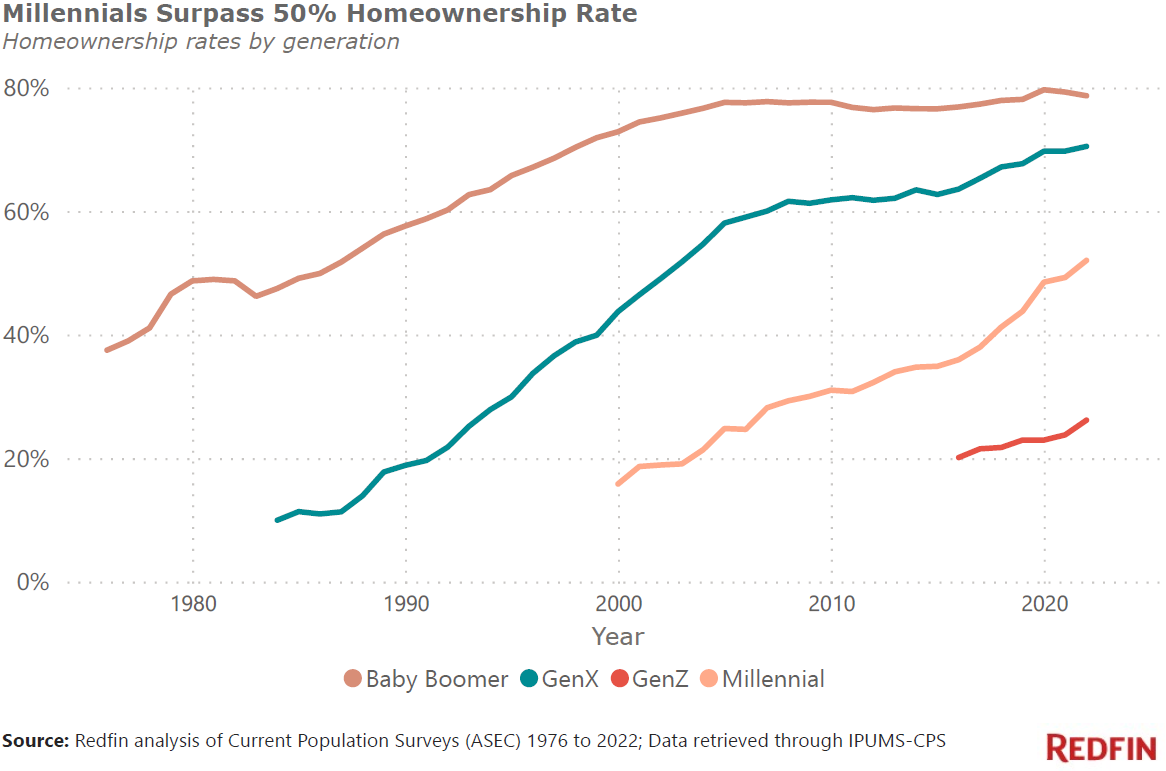
Overall, 26% of adult Gen Zers own their home. That’s compared with 79% of baby boomers, the highest share of any generation, followed by Gen X (71%) and millennials (52%).

Millennials make up the biggest piece of the homebuying pie
Millennials, along with the oldest Gen Zers and youngest Gen Xers, made up the lion’s share of home purchasers last year. People aged 25 to 34 bought one in three (33%) of primary homes that sold in the U.S. last year, the highest share of any age group. They’re followed by 35-44 year olds, who bought 27% of them.
Gen Zers are players in the homebuying game, though their share is small. People under 25 bought just over one in 20 (6%) of homes that sold last year. This home-purchase data includes only homes to be used as a primary residence that were purchased with a mortgage; roughly 30% of homes were bought in cash last year.

Generational homebuying trends have remained mostly the same over the last five years, with roughly one-third of primary homes purchased by people aged 25 to 34, and just over one-quarter purchased by people aged 35 to 44.
Younger people move more often and buy more homes than older generations because their life stages beget moving. Roughly half of homeowners under 35 own their home for less than three years, versus 15% of 35-64 year olds and 7% of homeowners 65 and older.
People in their 20s and 30s are entering the workforce, moving to different parts of the country, settling into their careers and turning from renters into homeowners, events that often require or at least encourage a move. Many of them are also getting married and having children, which often prompts a move to a different neighborhood and/or a bigger house.
Gen Z homebuyers are most prevalent in affordable areas; millennials buy in tech hubs
People under the age of 25 bought roughly 9% of the primary homes that sold in Virginia Beach, VA last year, a bigger share than anywhere else in the country. Next come Cincinnati, OH (8.5%), Detroit, MI (7.9%), St. Louis, MO (7.5%) and Indianapolis, IN (7.1%).
Those places are all relatively affordable, making it easier for young homebuyers to break into the market. In each of those metros, the typical home bought by a Gen Zer sold for $255,000 or less in 2022.
Virginia Beach is home to one of the biggest military bases in the U.S. and nearly half of mortgaged home sales use VA loans, which are available to service members and require very low or no down payments. The ability to put just a small amount down is advantageous for young buyers who haven’t built up a lot of savings.
The oldest Gen Zers and young millennials are buying big chunks of the housing stock in tech hubs.
People aged 25-34 bought 41.4% of the primary homes that sold in Seattle last year, the highest share in the U.S. It’s followed by Philadelphia (40.6%), Pittsburgh (39.8%), San Jose, CA (39.7%) and Austin, TX (39.6%).
| Share of homes purchased by Gen Zers and young millennialsTop 10 metro areas where people under 25 and people aged 25-34 bought the largest share of primary homes in 2022 | |||||
| U.S. metro area | Under 25 years old: Share of home purchases | Median sale price for buyers under 25 | U.S. metro area | 25-34 years old: Share of home purchases | Median sale price for buyers aged 25-34 |
| Virginia Beach, VA | 8.9% | $255,000 | Seattle, WA | 41.4% | $775,000 |
| Cincinnati, OH | 8.5% | $195,000 | Philadelphia, PA | 40.6% | $315,000 |
| Detroit, MI | 7.9% | $165,000 | Pittsburgh, PA | 39.8% | $235,000 |
| St. Louis, MO | 7.5% | $175,000 | San Jose, CA | 39.7% | $1,365,000 |
| Indianapolis, IN | 7.1% | $215,000 | Austin, TX | 39.6% | $475,000 |
| Pittsburgh, PA | 7.0% | $165,000 | Denver, CO | 39.2% | $555,000 |
| Kansas City, MO | 6.7% | $205,000 | Minneapolis, MN | 38.9% | $355,000 |
| Cleveland, OH | 6.6% | $165,000 | Detroit, MI | 37.7% | $205,000 |
| Warren, MI | 6.6% | $205,000 | Milwaukee, WI | 37.7% | $285,000 |
| Minneapolis, MN | 6.5% | $275,000 | Warren, MI | 37.6% | $285,000 |
Methodology
This report is from a Redfin analysis of data on home purchases by age group from the Home Mortgage Disclosure Act (HMDA) database, from 2018 to 2022. We examined originated loans for home purchases in the U.S. of 1-4 unit homes using conventional, FHA and VA loans; the data doesn’t include all-cash home purchases. We excluded purchases of manufactured homes. For the reported metro area results, we examined the age breakout of mortgaged home purchases in the top 50 most populous metros.
Data on generational homeownership rates was calculated from the Current Population Survey’s Annual Social and Economic Supplement (March Supplement), from 1976 to 2022. Homeownership rates are calculated for ages 19 and above. The data was accessed using IPUMS-CPS*.
Data on monthly mortgage payments and household incomes of 25 year olds was calculated from the 1990 Census and the 2021 American Community Survey. The 1990 figures were adjusted for inflation using the CPI. The data was retrieved using IPUMS-USA**.
*Sarah Flood, Miriam King, Renae Rodgers, Steven Ruggles, J. Robert Warren and Michael Westberry. Integrated Public Use Microdata Series, Current Population Survey: Version 10.0 [1976-2022]. Minneapolis, MN: IPUMS, 2022.
**Steven Ruggles, Sarah Flood, Matthew Sobek, Danika Brockman, Grace Cooper, Stephanie Richards, and Megan Schouweiler. IPUMS USA: Version 13.0 [Census 1990, ACS 2021].
Minneapolis, MN: IPUMS, 2023. https://doi.org/10.18128/D010.V13.0
Originally published on Redfin on April 21, 2023 by Dana Anderson and Sheharyar Bokhari


